
In a previous article we showed to how to use Blackfire.io to profile and boost a sluggish Drupal 7 site. This time, we noticed Evolving Web's shiny new Drupal 8-powered blog was loading slower than in D7, and we're suspecting it may be Drupal core itself that might be culprit. Let's dive into the profile and figure out what's going on!
Profiling uncached pages
The slow page this time is our own blog. Most of the time, Drupal 8's amazing page cache kicks in, and the page performs well, loading in under 100ms. But whenever any node is edited and saved, that page cache is invalidated, and the next load is much more sluggish at 455ms:
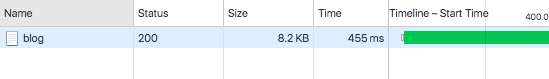
Not exactly terrible, but our new D8 website has hardy any contrib or custom modules enabled, so why is it noticably slower than the D7 page that we replaced?
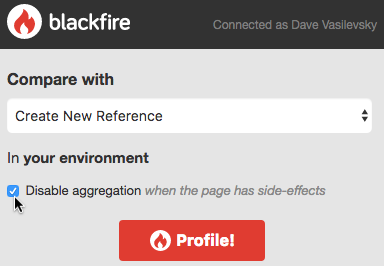
Again we'll turn to our PHP profiler, Blackfire.io, to figure out what's going on, but there's a little hitch. When it profiles a page, it helpfully attempts to reduce randomness by fetching the page ten times, and averaging the results. The first fetch will be uncached, (what we want to profile!)—but the next nine will be in Drupal's page cache, completely skewing our numbers. So we need to ask Blackfire to "disable aggregation":
Now we get a useful profile to analyse. We can see several potential problems here, but let's focus on just one for now.
Blocks are slow
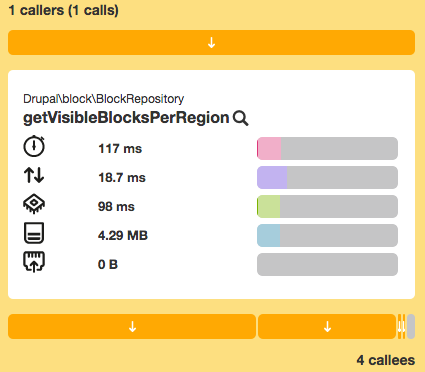
The big offender is BlockRepository::getVisibleBlocksPerRegion(). It's only called once, but it takes 117 milliseconds, or 17% of the total page load time!
This is the function that looks at the all the blocks on our site, and figures out which ones should be visible on the current page. It has to look at each block's visibility conditions, which say things like: this block should only be visible if the language is English, and the current node is of the type page, and the current path looks like /training/* .
We have a lot of blocks placed on this site, 147 in total. But blocks in Drupal 8 are used for so many things: Page title is a block, page content is a block, menus are blocks, breadcrumbs are blocks, views is in core and comes with oodles of blocks…it makes sense that we have so many blocks. Shouldn't Drupal be able to handle that?
If we look at our profile and the source code for getVisibleBlocksPerRegion(), it looks like a couple of things in particular are slow:
- We call
BlockStorage::loadByProperties()to load all blocks for our theme, just to check whether or not they're visible. There's already an issue on Drupal.org about this. On our site, this takes 40 ms. - We call
Entity::accesson every block. This eventually callsBlockAccessControlHandler::checkAccess(), which iterates through all the block visibility conditions and checks if they apply. It also checks if the block plugin itself has an opinion on visibility, and merges the cacheability metadata from all these calculations. Altogether, it takes 63 ms.
Do we really have to load every single block, just to check its visibility? And does the condition checking have to be so complex?
Implementing a fix: block_access_records
So we have a list of blocks, but loading each one and checking its visibility takes too long. This sounds familiar… Drupal already had this problem with access to nodes!
Drupal loves to present lists of nodes. It would be nice if we could load each node and call hook_node_access() on it, but that would be far too slow. So instead we use a system of grants and records: each node has its access records added to the database, and then a single DB query can check whether the current grants allow a node to be accessed.
There's no reason we couldn't do a similar thing for blocks. So I spent a day on prototyping a module called block_access_records. It takes Drupal's existing block visibility conditions, and puts them in the database, just like the node access system. Here's what the table looks like for one of our blocks:
+---------------------+--------------------+---------------+--------+
| block               | context            | value         | negate |
+---------------------+--------------------+---------------+--------+
| homeblocknewsletter | role               | NULL          |      0 |
| homeblocknewsletter | node_type          | NULL          |      0 |
| homeblocknewsletter | path               | /training     |      0 |
| homeblocknewsletter | path               | /training-faq |      0 |
| homeblocknewsletter | theme              | ewsite8       |      0 |
| homeblocknewsletter | language_interface | en            |      0 |
+---------------------+--------------------+---------------+--------+
The module can build a query to check the current page against all of these conditions, for all blocks at the same time. Then, thanks to Drupal 8's use of dependency injection, I can replace the core block.repository service with my own version that uses this query. Now our site does a single DB query to figure out what blocks should be visible! We don't have to do all the calculations ourselves, and we don't have to load every single block.
Of course, there are caveats, this module is very new and doesn't support everything under the sun. You should probably read the README before using this on your own site.
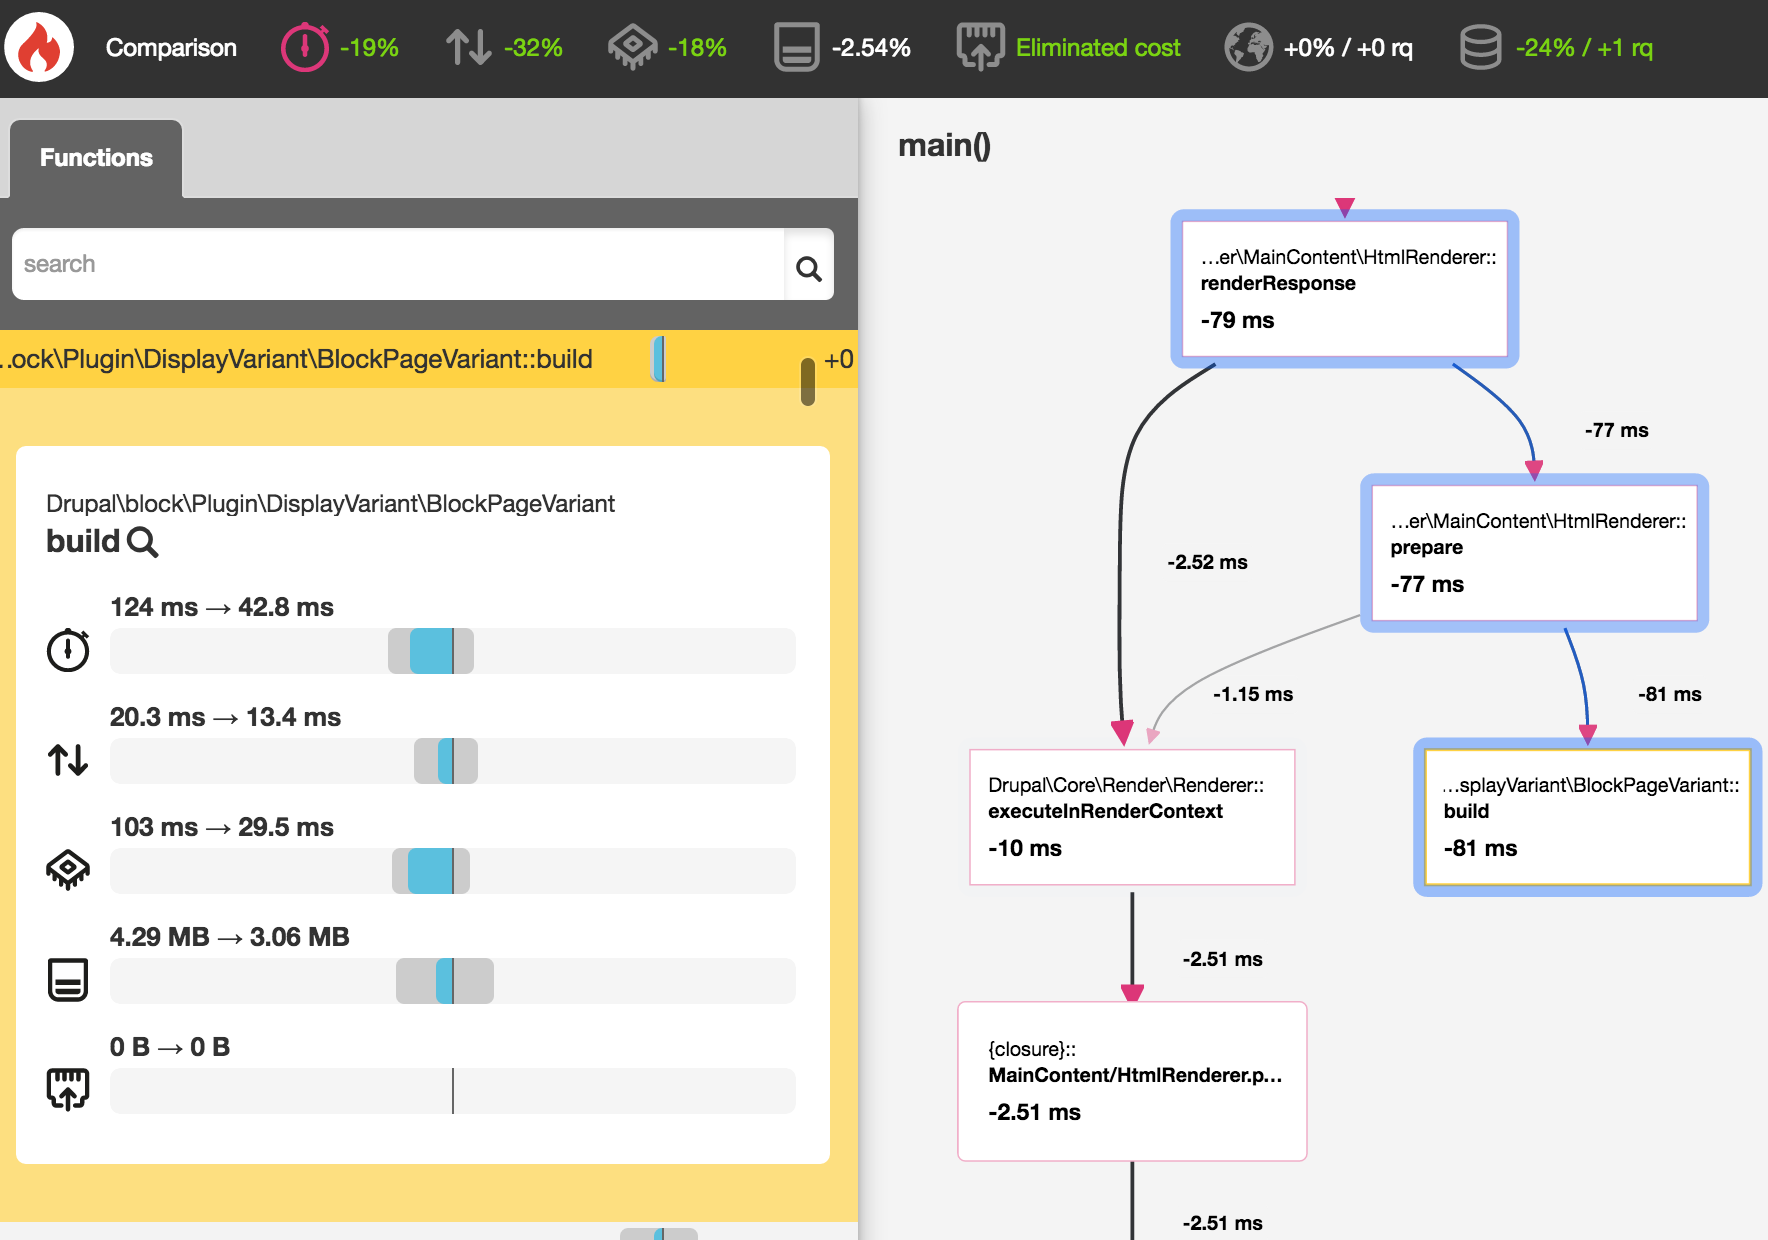
Measuring the improvement
After implementing any performance tweak, always carefully measure the improvement! Drupal's extensive use of static caches means removing a costly entity load might simply force it to happen later in the same request. So I generated another comparison profile with Blackfire.io. Using the original profile as a reference, it reports that we saved around 19%, or over 100 milliseconds, and reduced our memory usage by 20%! While I'm pretty sure some of the difference is random noise, 80ms of the savings is coming from BlockPageVariant::build(), the parent function of getVisibleBlocksPerRegion(). Looks like our change worked!
What's next
We hope this article will encourage you to come to my talk at DrupalCon New Orleans about profiling Drupal with Blackfire.io! Or if you just can't wait, you should definitely try running Blackfire.io to try profiling your own Drupal 8 site today.
I'd also love to hear your feedback for the module. Do you think core should have a system like block_access_records? Can you think of a better way to make block visibility fast? Tell me on in a comment, or via Twitter at @djvasi.